Monday, June 01, 2020
Are the importance/satisfaction matrices usable?

The Importance/Satisfaction matrix enables you to see all the attributes of customer satisfaction at a glance.
What is an Importance/Satisfaction matrix?
There are several possible representations of this visualization, but let's say, for simplicity's sake, that you generally find the level of satisfaction on the x-axis, and the level of importance on the y-axis.
- Satisfaction level: This is the easiest to calculate. You need to determine your attribute indicator (defined by default in the SatisFactory Feedback solution). It can be a percentage of 9-10, the average, a CSAT (%4-5 - %1)...
- Level of importance: this is the attribute's ability to influence your key indicator (such as NPS, for example). It's a little harder to calculate, but in its simplest version, it's the linear correlation between the attribute and the key indicator you're trying to improve (NPS, Overall Satisfaction...). In more complex versions, you can factor out the number of respondents, use Bayesian networks...
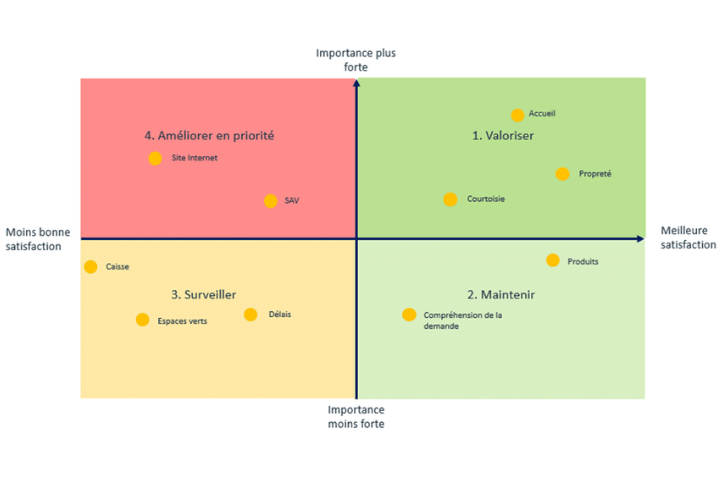
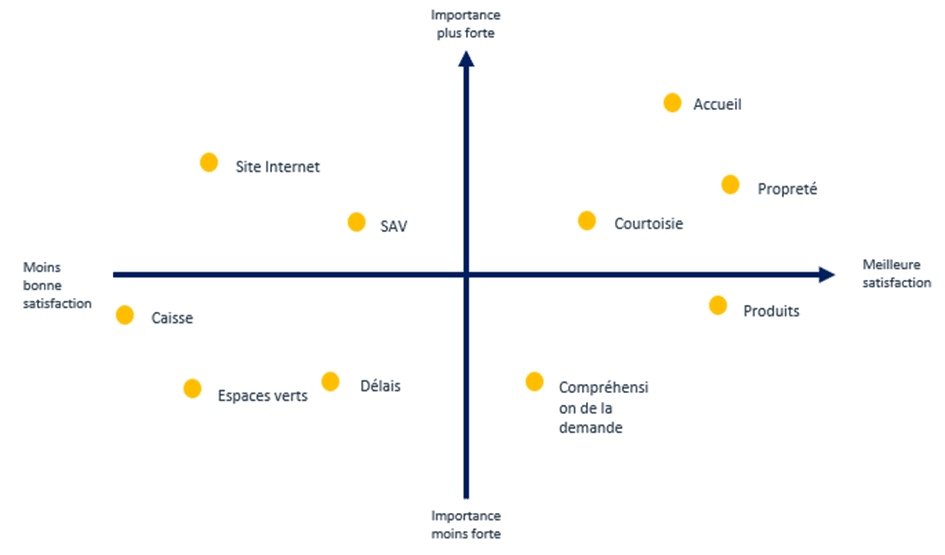
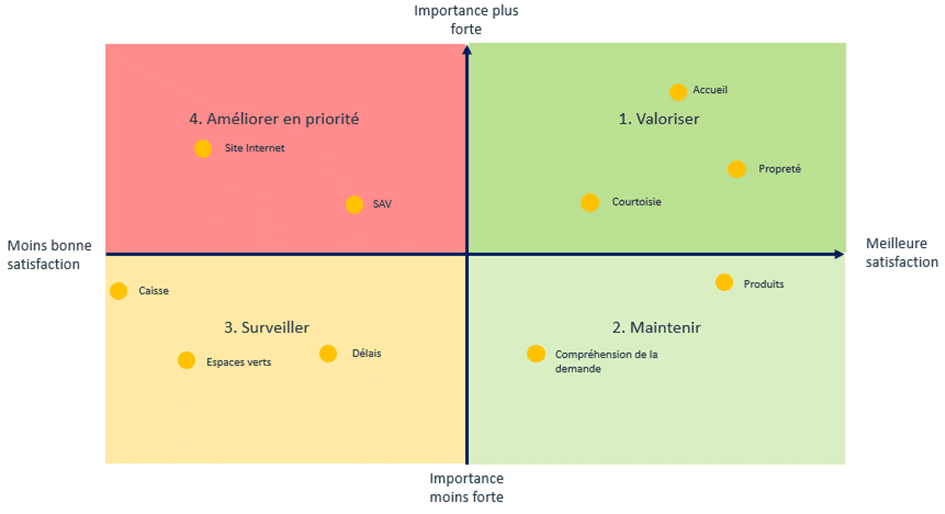
Once each point has been defined, the result is a matrix as shown below.

In this example, Reception has a lower level of satisfaction than Cleanliness, but a much higher level of importance. These 2 attributes therefore seem equally crucial to maintaining a good level of satisfaction.
How to read an Importance / Satisfaction matrix?
Once the attributes have been placed on the matrix, all that remains is to read it.
It is generally accepted that the Importance/Satisfaction matrix is divided into 4 quadrants:
- Value: the top right-hand quadrant groups together attributes that are of high importance and satisfaction. These are the attributes you can value and communicate about.
- Maintain: The dial at bottom right groups together attributes with relatively low importance but good satisfaction. You should therefore maintain these attributes, but they do not represent a strategic issue for you.
- Watch: The bottom left-hand dial groups together attributes of relatively low importance and relatively low satisfaction. Although you can work on them, they are not given priority because of their low influence on the key indicator.
- Priority for improvement: The dial at top left groups together attributes with high importance and relatively low satisfaction. These are your core actions. All these attributes penalize your key indicator.

Is the Importance/Satisfaction matrix accessible and usable?
The main problem with the Importance/Satisfaction matrix is its complexity. It is, by nature, difficult to read and operate.
The proof: it took several lines of explanation to describe it. How long would it take an operator to understand it? To interpret it? And to know what to act on?
This is all the more the case when it includes a large number of attributes. In the example above, this is relatively clear. The operations manager has to work on the website and after-sales service. But what if I had a dozen attributes in this "Priority improvement" quadrant? Are all the attributes actionable by the operational team? What about other sites or stores within the group that are comparable to this site/store? Do they also have a problematic after-sales service, or am I the only one in this situation?
In conclusion
The Importance/Satisfaction matrix provides a clear, operational overview of all satisfaction attributes at a glance.
It's just a question of understanding it and getting your operational staff to understand it.
The Feedback solution now offers a much simpler and more usable approach to this matrix, and does so natively. We encourage you to contact your Customer Success Manager for more information.


